


Business, Digital, ERP, SAP, Finance transformation
is really hard
54% of leaders say their organization doesn’t have a clear vision for transformation
Create the clarity you need to get on
with the business of transformation
You can't transform what you can't see
A picture paints a thousand words, right?
So why are the crucial enterprise diagrams that describe your business locked away in out-of-date digital sketches like Powerpoint or Visio, and then passed around as email attachments?
What if the pictures that describe your business today and tomorrow were built dynamically using the knowledge of what you actually do?

Draw with knowledge
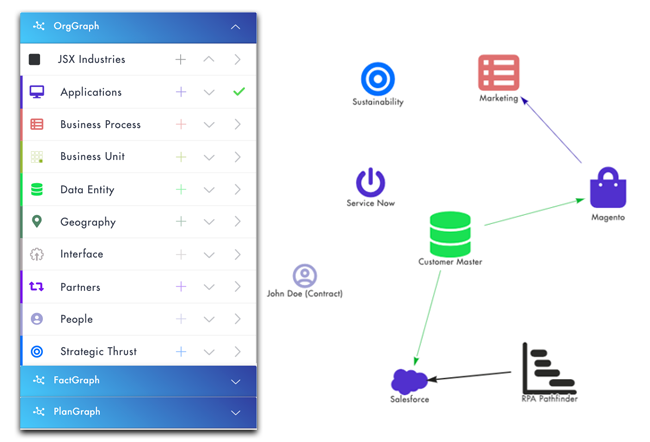
With FusionGraph, you visualize your enterprise using a knowledge-base of the things that define you.
Business processes, systems, data, people, partners, strategies, projects - in fact anything. And, all of their interdependencies.
Because FusionGraph is built on cutting-edge Graph Database technology, you can cut through complexity and finally see your business with clarity.
Which is crucial if you care about transformation.
Visualize the people, processes and technology that make up your unique enterprise
Describe the intricate complexities of your business world simply using sophisticated Graph Database technology.

Share an always-up-to-date view of the knowledge in your enterprise
Hyper-accurate connected knowledge that describes what's really going on in your business world so that you have a solid foundation for transformation.

Get a single connected view of everything that's being done or needs doing. Everywhere.
See plans, phases, waves, initiatives, roadmaps, sprints and actions in one place. Connect plans to facts and organisational context so that everything finally makes sense.

Comprehensive curated datasets that educate your team to underpin transformation.

FusionGraph for SAP shows you what's new and different in every version of SAP S/4HANA and ECC.

![]()
FusionGraph for APQC shows you APQC Process Frameworks and KPIs to drive business best practice.